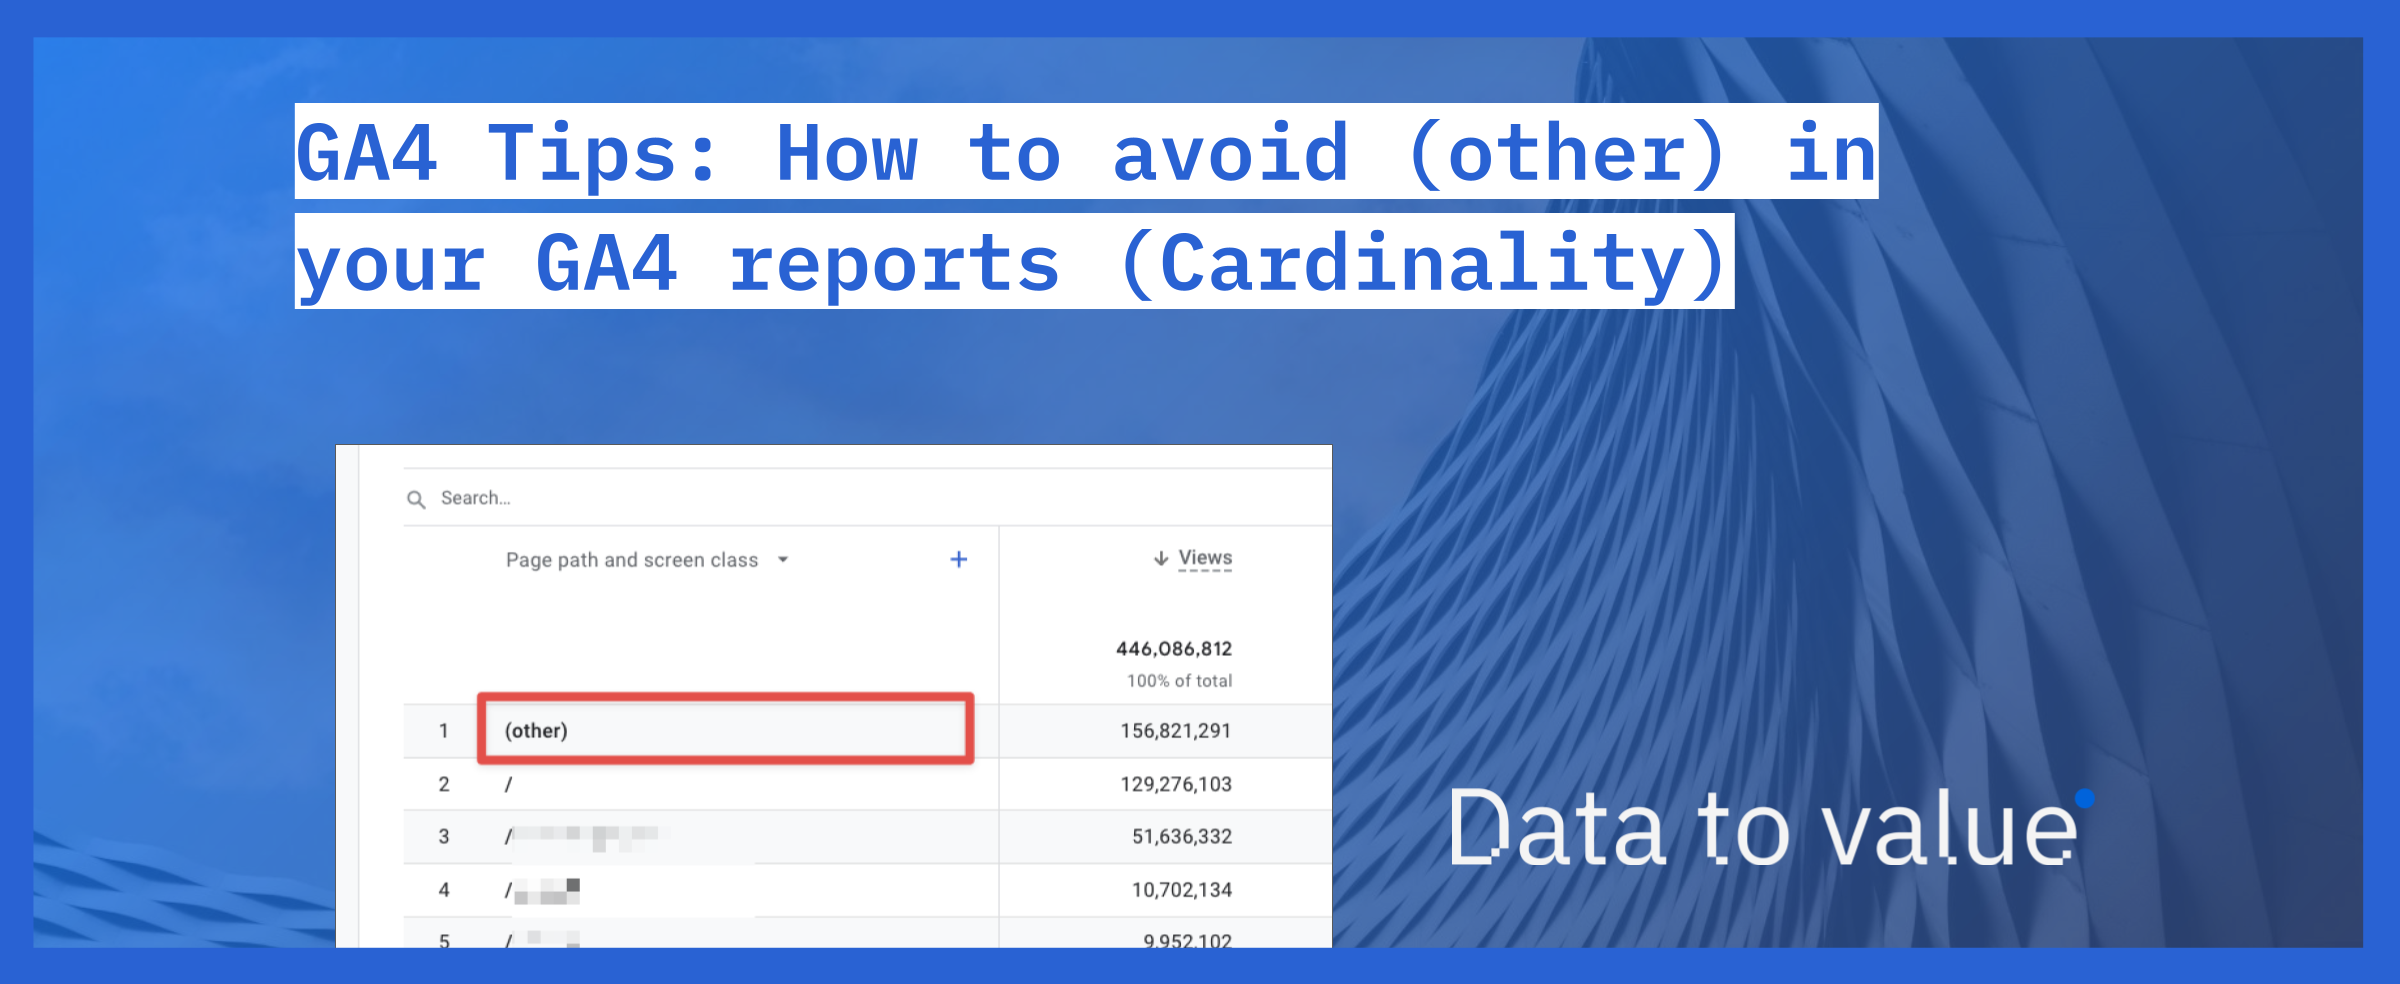
If you’ve worked with Google Analytics 4 (or even Universal Analytics) before, you might have noticed this “(other)” value in your reports. In this article, I’ll go through what it is, what causes it, and what you can do to prevent this from happening.
(other) in your Google Analytics 4 reports

When you see a dimension with value “(other)” it means that a lot of unique values were grouped together and instead of being reported as individual rows, they are reported under the same value – “(other)”. This means that you lose the ability to analyze the values that are grouped under the “(other)” (or to break them down into individual values). This is a huge issue as it hinders your ability to analyze data and get the full picture. To understand why this is happening, we need to talk about cardinality.
What is cardinality?
Cardinality refers to the number of unique values of a dimension. For example, if you have a dimension with a boolean value (e.g. Is the user logged in?) – this dimension can only have two possible values – true or false. Thus the cardinality of this dimension is 2, and it would be considered a low cardinality one.
On the other hand, you can have a dimension like Page Path. Each page has its own Page Path, meaning that the cardinality of the Page Path dimension is equal to the total number of pages on your website (assuming that every page was viewed at least once). Keep in mind that if the Page Path contains any query parameters, each unique combination of those also adds to the total cardinality of the Page Path dimension. In other words, Page Path “/category” and “/category?p=1” are two unique values.
In Google Analytics 4, every dimension that records more than 500 unique values per day is considered a high cardinality dimension (source).
These high cardinality dimensions increase the likelihood of the report hitting the row limit and causing any data past the limit to be condensed into the “(other)” row.
When you look at the table in Google Analytics 4 interface, that table is actually built on top of the underlying database table. If this database table reaches the row limit, all rows that are above the limit are condensed under the “(other)” row. This underlying table, however, doesn’t only contain the dimension that you are seeing in your GA4, but it might contain many others – this means that sometimes data that isn’t shown in the report also contributes to the row limit.
What can you do about it?
There are a few things you can do to minimize the possibility of the “(other)” row ruining your day and making analysis in Google Analytics 4 near impossible.
1. Avoid high cardinality dimensions (User ID, Session ID etc.)
You really want to think twice before registering custom dimensions like Event ID, Event Timestamp, but also Session ID or Client/User ID. All of these would likely cause high cardinality issues for a majority of websites (if you have more than 500 unique users per day, they would already).
2. Reduce high cardinality at the data collection point if possible
We have a client who has multiple millions of unique URL’s being used every day. However, from a analysis point of view, these URL’s could be grouped into ~100 URL’s and there is no added value for analysis to break them up into unique URL’s.
We’ve created custom JavaScript logic in Google Tag Manager to redact these URL’s into more generic ones that do not cause cardinality in the reports. As a backup, we’ve stored the original URL in a event parameter which we did not register as a custom dimension so that we can always access that in BigQuery.
2. Use standard reports
Use standard reports when possible. Standard reports have aggregate tables that decrease the likelihood of condensing the data under the “(other)” row.
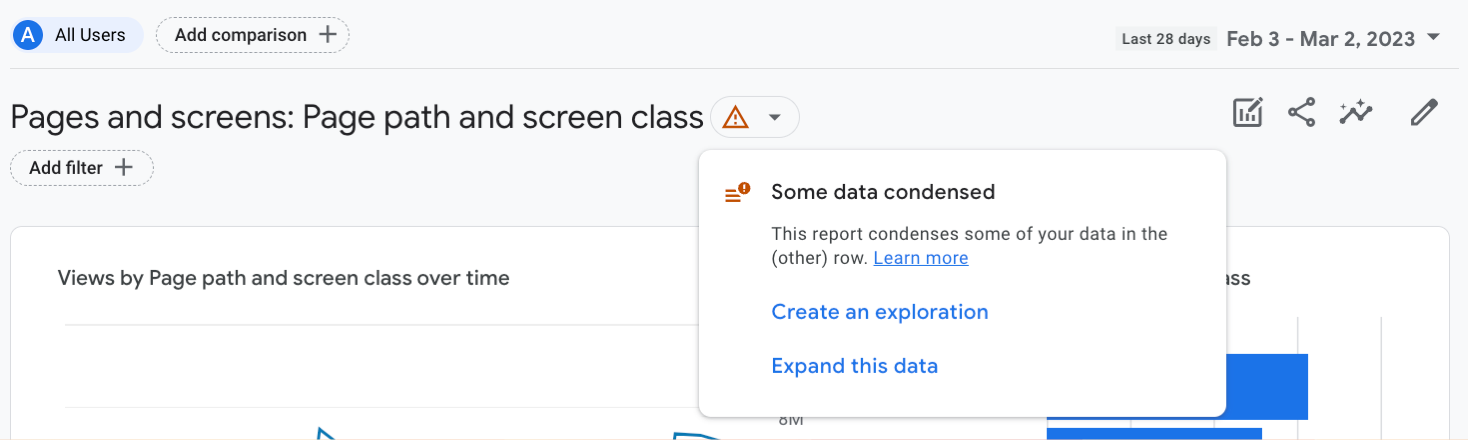
3. Exploration with lowest sampling rate
If you experience the “(other)” row in your standard reports, you can recreate the report in the Exploration interface. Google recently added a new option under the data quality icon (see screenshot). Besides the information that the data in this report is condensed, it also gives you the option to recreate the currently viewed report in the Exploration. If you are working with a paid Google Analytics 4 360 account, you also have the option to Expand data (more on that later).
This exploration however can (and probably will be) heavily sampled, so be aware of that.
4. If you need them, send them as a event_parameter for usage in BigQuery
You will experience this “(other)” row only when exploring data directly in the GA4 interface. Your BigQuery export won’t be affected, so if you really need that high cardinality dimension in your GA4 dataset, you might consider sending it just as a event_parameter in your GA4 tags and then access it in BigQuery.
Remember: the cardinality issue only arises once you register a custom dimension for your event_parameter in the Google Analytics 4 interface. If you don’t, the values simply don’t show up in the interface, and there is not cardinality issue. The data will always show up in the BigQuery data export.
5. GA360 – Higher limits And Expanded Data Sets
The last option is to consider the paid version of Google Analytics. This has a significantly higher limit (we don’t know the limit exactly) before the “Other” issue starts to appear.
GA4-360 also provides so-called Expanded data sets. Expanded data sets expand the data in the “(other)” row into a separate row. You don’t need to do any action to enable this feature, as it is activated automatically for frequently viewed reports in GA360.
In closing
Cardinality is a issue we see in a lot of Google Analytics accounts that we audit. You don’t get a warning when it is (about to) happen, and during testing and development it usually does not show up yet. It’s a big issue for analysts, especially if they are unable to work with the BigQuery dataset and are limited to the GA4 interface to do their job.
Hopefully the limits will increase in the future, making the issue less prevalent. But for now, we will have to be vigilant and decrease the amount of unique values we store per dimension.